
This article by Professor Jorge Sá was recently published on the blind-referee Journal of Social and Economic Studies (USA).
Professor Jorge Sá, a Peter Drucker expert and a speaker on Peter Drucker, is a senior research fellow at Peter F. Drucker and Masatoshi-Ito Graduate School of Management in Los Angeles, a visiting Professor at IESE associated AESE and a Professor at ISG Business School.
(site: www.vasconcellosesa.com ; e-mail: associates@vasconcellosesa.com)
Read the full article below:
Lessons From the Subprime Years For the Covid Years
Authors: Jorge Sá and Natália Teixeira
From Subprime Crisis to the Covid Years
The December 2007 New York stock exchange slump marked the beginning of the subprime crisis in Europe, which lasted until the IMF left in 2014. And the period from 2008 to 2014 was considerably different from the previous since the start of the millennium when the EU-27 Gross National Income at constant prices grew by 2,4% yearly (AMECO, 2021).
The origins of the subprime crisis call for an aggressive response with the need to restructure the institutional foundations of the financial system for the return of confidence in the markets (Shiller, 2012). Ryan (2008) describes how the subprime crisis evolved in different waves and increased in intensity over time. On the other hand, Duchin et al. (2010) study the effect of the financial crisis on business investment, constituting a negative shock to the supply of finance to firms.
Fidrmuc & Korhonen (2010) argue that movements in business cycles have increased as a result of the global financial crisis, with trade integration playing a less important role for business cycle convergence. Cowling et al. (2012) argue that throughout a recessionary cycle, the small business lending market is in disequilibrium (difference between demand and availability of finance), and this benefits neither banks nor small businesses. Schwarcz (2008) argues that the crisis can be largely accounted for by three factors: conflict, complacency and complexity.
Altunbas et al. (2011) exploit the subprime financial crisis to analyse the impact of risk on the banking business model. According to the authors, business models with lower level of bank risk were characterised by a strong deposit base and greater income diversification (Altunbas et al., 2011).
In terms of financial risk, Demyanyk & Van Hemert (2011) analyse the quality of subprime mortgage loans, finding that this quality deteriorated even before the crisis due to the credit boom scenario. For Altunbas et al. (2011), one of the main reasons for the existence of banks is their superior ability to assess and manage risks than other institutions. Mishkin (2011) argues that the global financial system is much more interconnected and the excessive risk-taking that threatened the collapse of the global financial system was much more pervasive, and it is critical to develop policies to minimise systemic risk.
There has been considerable research on the subprime crisis on its macroeconomic impact [(Edey, 2019): (Gurtner, 2010); (Terazi & Senel, 2011); (Beer, 2012)] and the implications for broad economic sectors: services, agriculture, etc. [(Khudyakova & Shmidt, 2019); (Moore & Mirzaei, 2016); (Setar & MacFarland, 2012)].
The COVID-19 pandemic had far-reaching consequences and generated significant economic uncertainty, with measures of containment and social distancing causing falls in production, trade, investment and employment worldwide (Sarker, 2020), causing an exogenous shock for many economic actors, in particular innovating start-ups (Kuckertz et al., 2020). Pak et al. (2020) assess the economic and financial effects of COVID-19, much derived from reactive behaviour to the crisis rather than proactive which is critical to the defence of economic prosperity, defence of employment and global output.
The pandemic COVID-19 had severe economic consequences worldwide, affecting all countries even if at different levels, with drastic changes in business and consumer behaviour (Donthu & Gustafsson, 2020). According to Hafiz et al. (2020), the economic and financial ramifications of the COVID-19 outbreak are severe, with three correlated policy priorities such as providing social security to individuals, reconciled with managing systemic economic and financial risk, while maintaining encouragement of social behaviours that contain transmission of COVID-19.
Subsequently, and to a lesser extent, such analyses have been extended to the economic consequences of the Covid pandemic, particularly in macroeconomic terms [(Fernandes, 2020); (Sikder et al., 2020); (Ozili & Arun, 2020); (Roy, 2020); (Lorenzo & Lean, 2020)].
In this study, it is intended to complement previous research, with a focus on the opportunities (not so much on the risks) generated by the crisis, and a micro-level approach, with analysis of the segments of the economy. The Eurostat defines industries with two digits (there are 88 in the economy) and segments with four digits (a total of 615 in the economy).
Using the Eurostat databases (five databases were used such as production in industry; economic accounts for agriculture; annual detailed enterprise statistics for construction; annual detailed enterprise statistics for trade; and annual detailed enterprise statistics for services), the study intends to present empirical evidence that, during the subprime period (2008-2014) some segments not only continued to grow, but even accelerated their growth; Most of these segments belong to some very specific industries and economic sectors; Even within industries that were not resilient in the subprime years, it is possible to find accelerating segments; In addition to the existence of resilient segments, the whole structure of the economy changes during the crisis; and, finally, that the available data on Covid 2020 are compatible with the above inferences.
Resilient segments during the subprime crisis (2008-2014)
Based on Eurostat data (2021), it was selected the 53 segments that, out of the 615 that constitute the economy, accelerated during the subprime crisis (Table 1). The sample’s study excludes all non-transationable goods such as public administration. The table analyses the segments of the economy by classifying them by name and Eurostat code, the annual growth rate in the pre-crisis period (2000-2007), Those are global, average values, for the economy. The annual increase during the subprime (2008-2014), with the respective differences in growth rates and classification in terms of degree of acceleration.
Table 1 – Ranking of the 53 segments which accelerated during the subprime crisis
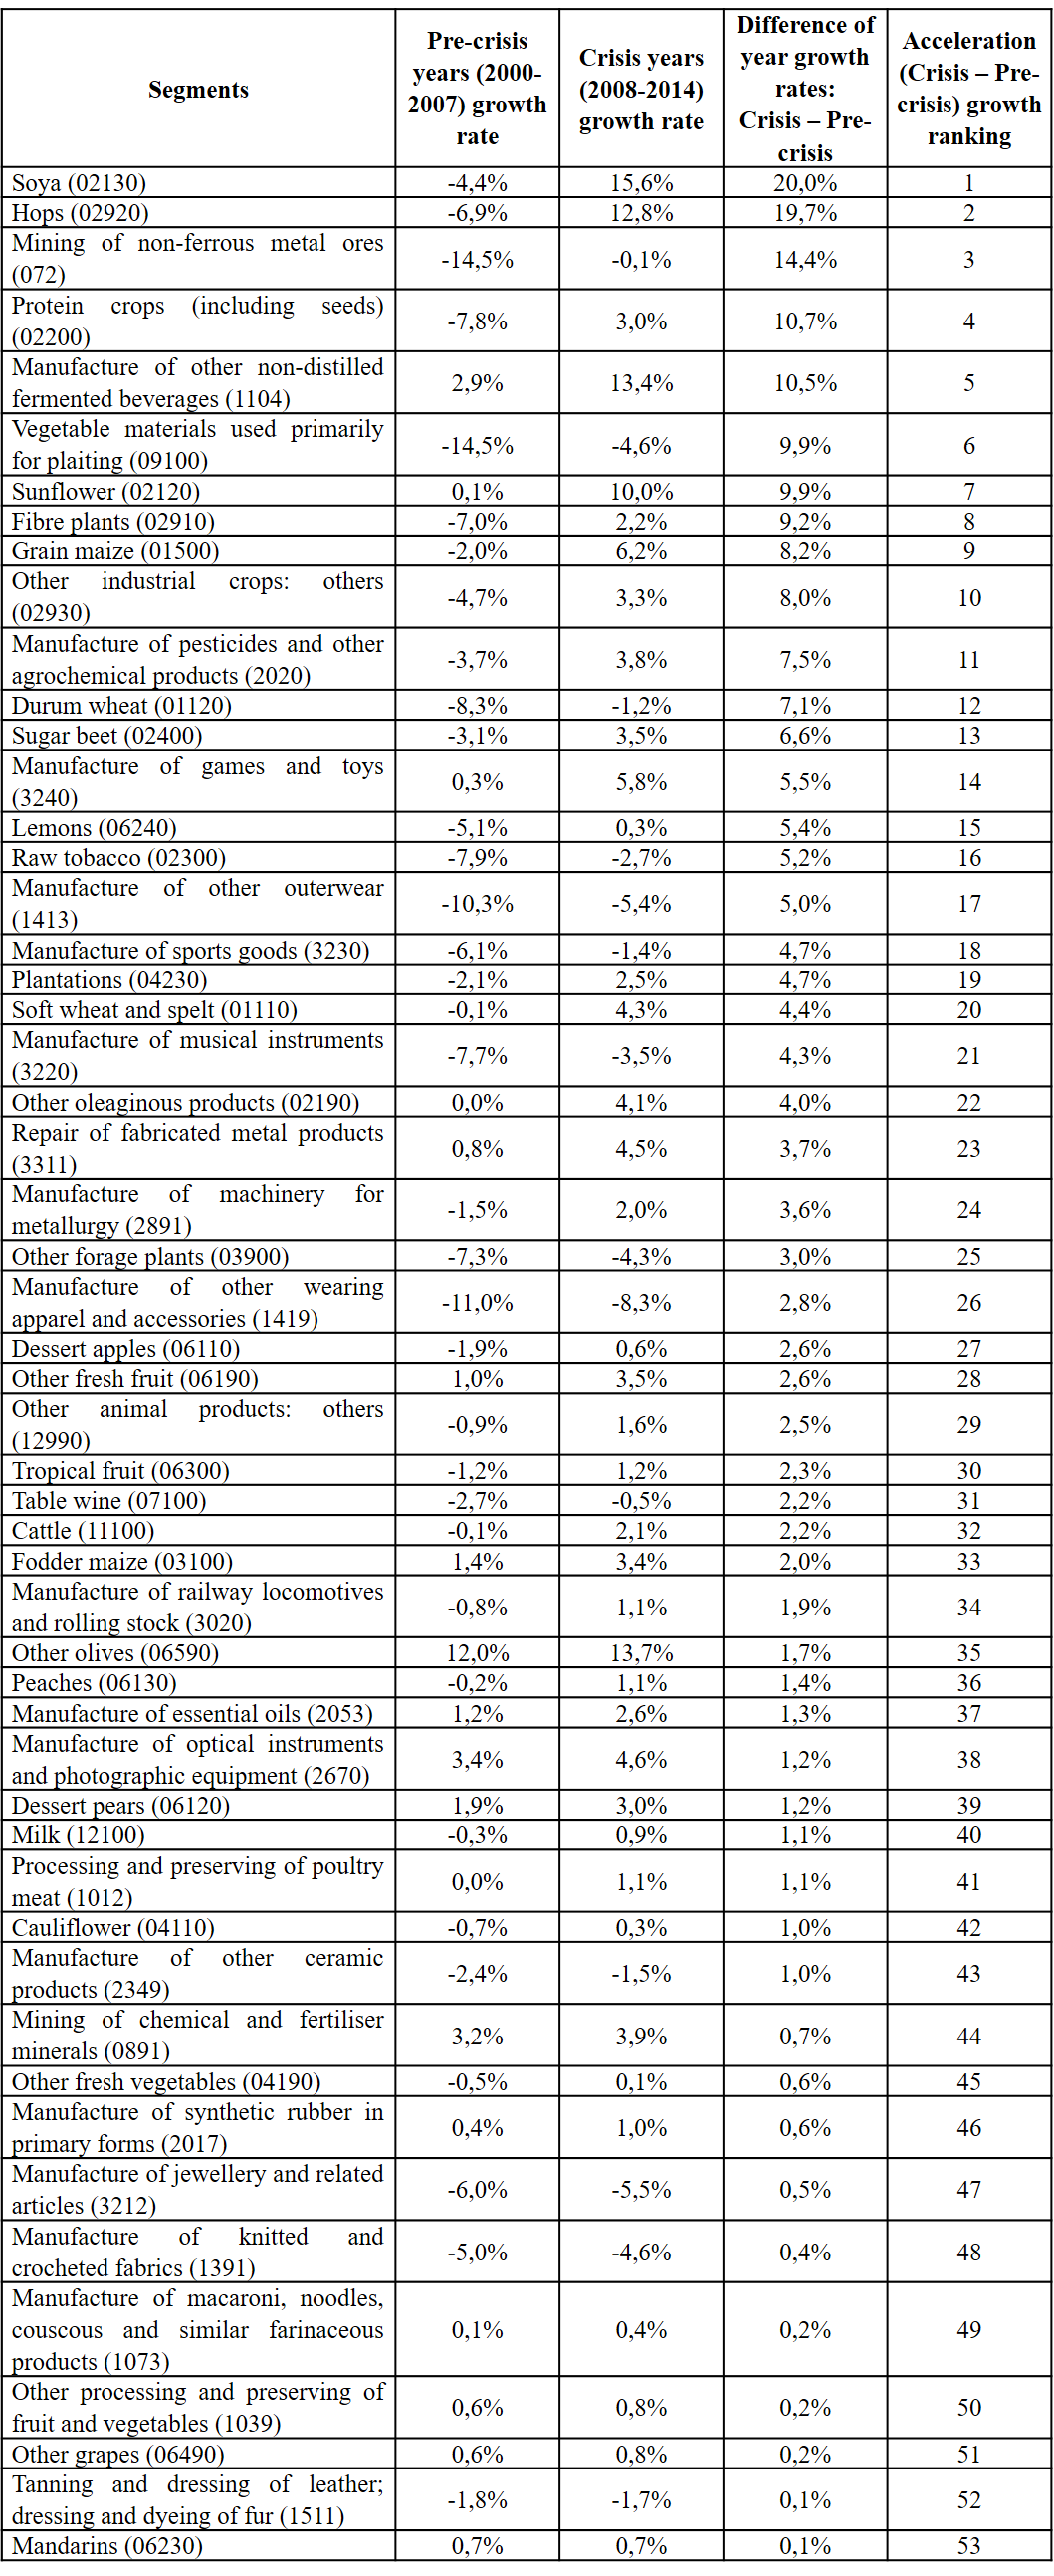
The first striking feature is the exceptionalism of the best performing segments. In the European economy, the difference in growth rates between the crisis and pre-crisis period was -2.1% in terms of national income and -4.6% for all segments in this study. These are overall, average, values for the economy. However, the first ten segments in Table 1 accelerated their growth a maximum of almost 20% (soybeans) and a minimum of 8% (other industrial crops like stevia and sugarcane). And among these top ten, nine are food-related: soybeans (20%), hops (19.7%), protein crops (10.7%), non-distilled beverages such as vermouth (10.5%), braiding vegetables (9.9%), sunflower (9.9%), fibre plants (9.2%), maize grain (8.2%), and other industrial crops, i.e. stevia, sugarcane, miscanthus, aromatic, medicinal and culinary plants, etc. (8%).
The only exception of the non-food industry segments among the top ten ranked is non-ferrous metal ores extraction, which due to increasing Chinese competition before the crisis (years 2000-2007) decreased -14.5% annually and after the adjustment managed to reach stagnation during the subprime years (Eurometaux, 2021[1]).
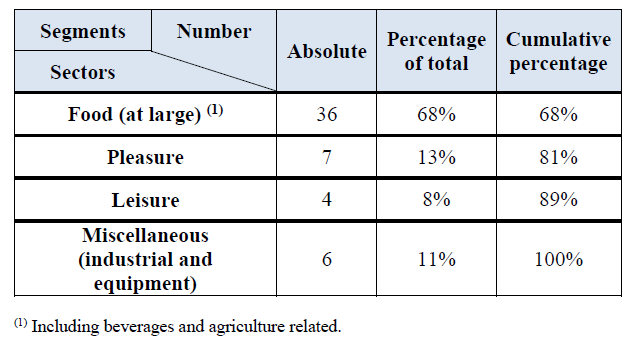
Looking specifically at the 53 segments in Table 1, the conclusion is that they belong to four categories. Again, and foremost food (including agriculture and therefore agrochemicals and fertilizers) with a total of 36 segments, representing more than 2/3 of the total (68% of the total): in addition to the first ten mentioned above, they include all types of fruit (dessert apples, peaches, tropical fruits, etc.), various types of crops (durum wheat, fodder corn), poultry meat and animal products (eggs, cheese, milk), table wine, olives, fresh vegetables, etc.
Then there is the pleasure sector with seven segments and representing 13% of the total: jewellery (and related products), tobacco, essential oils (Aromatic and used both for perfumes and food so could also be classified in the food sector: it is ranked 37th and accelerated 1,3%), knitted fabrics, leather products (shoes, bags, etc.), clothing and other outerwear: coats, jackets, trousers, skirts.
The leisure sector has four (8%) segments: games and toys, sports goods, musical instruments and photographic equipment. Thus, almost nine out of ten of the 53 segments that accelerated their growth during the subprime belong to either food (68%), pleasure (13%) or leisure (8%), with the rest being a set of six industrial and equipment segments: non-ferrous metal ore mining (ranked 3rd), repair of metal products (23rd), metalworking machinery (ranked 24th), locomotive and rolling stock manufacture (34th), ceramic products (43rd) and synthetic rubber (46th). Table 2 summarises these findings.
Table 2 – Categorization of the 53 segments which accelerated during the subprime(positive difference between crisis and pre-crisis growth rates)
Resilient segments among non-resilient industries
The segments analysed in the previous sections are subsets of industries (a total of 88 in the economy, but excluding non-transationable goods such as public services, defense, etc., they total the 75 industries analysed). And the number of segments the Eurostat recognizes within each industry varies. For instance, the manufacture of machinery industry includes 21 segments from metallurgy to machinery for mining, construction, or the manufacture of ovens and furnaces. Also the Eurostat divides retail trade into 37 segments, including medical and orthopaedic products, pharmacies, specialists on cosmetics and toilet articles or watches and jewellery stores, and so on.
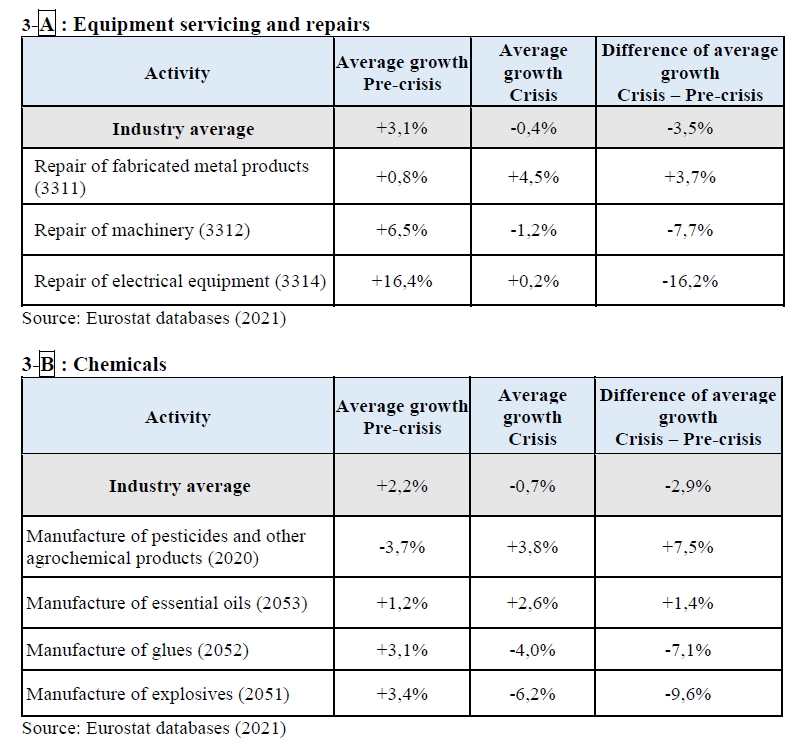
Some of these industries were in average more resilient than others. For instance, publishing activities (Eurostat code 58: books, magazines and computer games) went from zero growth in the pre-crisis period (2000-2007) to +1,2% per year during the subprime years (2008-2014). And fruits accelerated from +1% to +1,6% year rate (from pre-crisis to crisis). However and as, it is natural, during the subprime period most industries slowed down from the pre-crisis to the crisis period: manufacture of furniture (-4,6%) (from -0,1% in pre-crisis to -4,5% in crisis), equipment servicing (-3,5%) or chemicals (-2,9%).
For instance, equipment servicing e.g., declined in average by -3,5% (from a pre-crisis year rate of +3,1% to a crisis one of -0,4%). And it includes segments which slowed down by -16,2% (electrical equipment) or -7,7% (repair of machinery). However, it also includes a segment which not only grew but even accelerated its growth (from pre-crisis +0,8%, to crisis +4,5%), namely the segment (Eurostat code 3311) which respects equipment whose repairing not only cannot be postponed, buttauxme also in growth periods would be bought new: shopping carts, metal tanks and reservoirs, steam generators, or power boilers.
Still, within the chemicals industry which had an average year decline rate of -2,9% (from pre-crisis +2,2% to crisis -0,7%) the segments of explosives (mostly used in mining and construction) and glues (including adhesives), slowed down by -9,6% and -7,1%, respectively. However, and on the contrary, agrochemical products (which are food related) practically reversed their performance from -3,7% in pre-crisis to +3,8% in crisis; and odoriferous products for the manufacture of perfumes or food components accelerated by +1,4% (from +1,2% to +2,6%: pre-crisis to crisis).
In short, even within declining industries there are resilient segments, as illustrated by Table 3 which contrasts for the equipment servicing and chemicals industries, the overall averages, the worst segments and the resilient ones.
Table 3 – Resilient segments within declining industries
Changes in the whole industries structure during crisis
The previous sections presented evidence for the existence of resilient segments across the economy in general and even within declining industries. But, besides the existence of exceptional segments during crisis, something more overall occurs: the whole structure of the economy seems to change, that is, and for all economy industries and segments at large, what grew more in pre-crisis has no relation whatsoever with what accelerates more in crisis; and vice-versa.
Table 4 presents the correlations between pre-crisis growth and crisis acceleration, with respect to industries across the economy, segments across the economy (the analysis was done for the 150 best performing segments in the economy among all 615, since our interest is on exceptionalism) and segments within the two industries of equipment repairs and chemicals.
Table 4 – Correlation coefficients (significance level) between pre-crisis growth and crisis acceleration
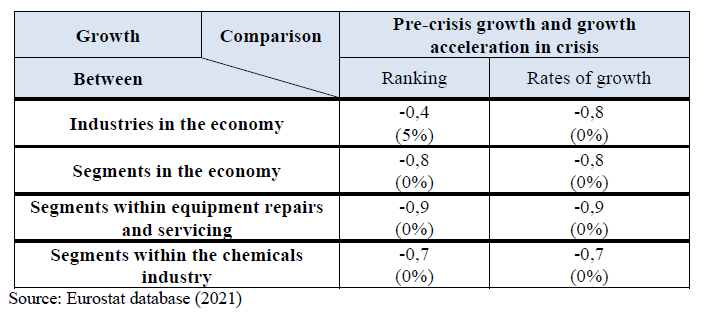
In all eight instances the correlations are negative and statistically significant, indicating both inverse rankings and rates of growth. And it is specially noteworthy the fact that in spite of the small number of segments (and thus observations) within the equipment repairs and chemicals industries (six and fifteen respectively), the correlations are nevertheless significant at zero level.
The “Covid test” on the subprime lessons
There are several theoretical arguments to presume that the subprime lessons on resilient businesses may be valid for the Covid crisis.
Among them: 1) resilient businesses are at the top of the economy and thus far from the roots of an economic crisis; 2) there is no conceptual relation between the types of resilient businesses during the subprime (food, pleasure, leisure) and the cause of the present recession (the pandemic); 3) resilience was defined as segments not only keeping on growing but even accelerating their growth and why should they?; and 4) finally one were able to draw sensible and similar explanations for resilience in all instances: segments within the economy and segments within the industries.
So, these theoretical arguments suggest that the subprime lessons may stand in spite of the Covid crisis cause being different. But the decisive argument is empirical evidence comparing the subprime period of 2008-2014 and the Covid year of 2020 (the only year of data available at the date this article is written).
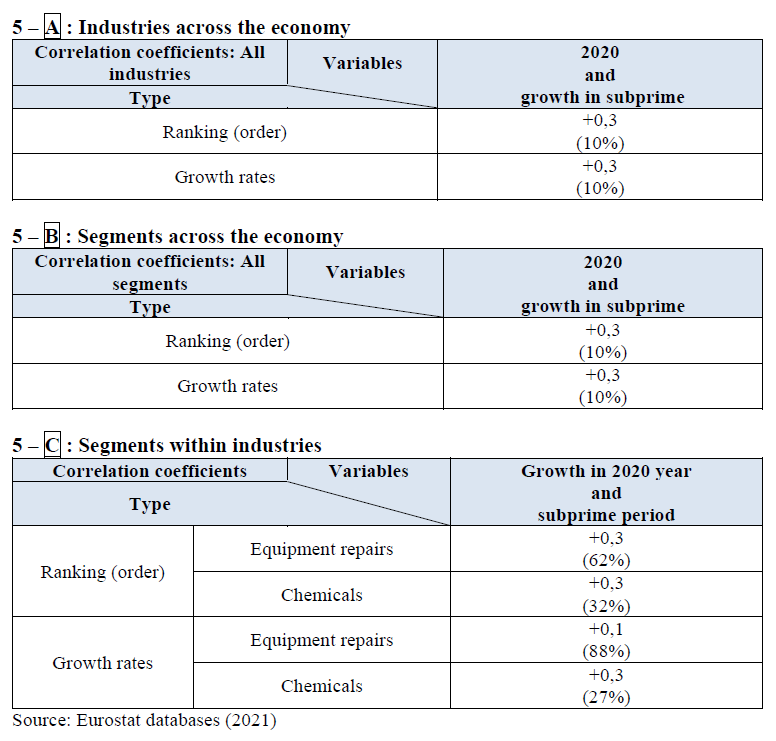
For such a purpose eight tests were performed: correlation coefficients for industries across the economy; segments across the economy; and segments within the equipment repairs and chemical industries. Table 5 presents the results (within brackets the significance level) and all eight correlations are positive suggesting a similarity between what grew in the two periods.
However, the correlation coefficients of the segments within the industries are not significant what may be due to the small number of observations (six segments in the equipment repairs industry and fifteen in the chemicals one). In any case, the empirical evidence – and notwithstanding the theoretical arguments – is more conducive to accept the similarity between the subprime period (2008-2014) and the Covid 2020 year, than the opposite conclusion.
Table 5 – Comparing growth in 2020 with the subprime period (2008-2014)
Conclusions
It is well known that economies are highly heterogeneous entities. Therefore, there is considerable variation between industries in the economy, segments in the economy and even segments within industries. These differences occur in periods of both growth and crisis. And in relation to the (industries and segments) growth or acceleration.
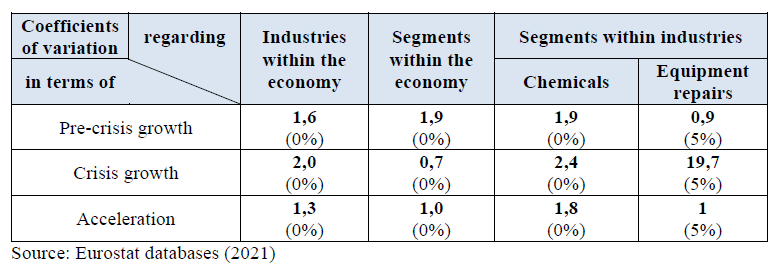
Thus, all coefficients of variation (ratio between standard deviation and mean) in table 6 are statistically significant at high levels: zero or 5% (in the unique case of the equipment repair industry which has only six segments).
Table 6 – Coefficients of variation (level of significance)
But this article provided empirical evidence for five further tenets. First, the variance is large enough so that resilient businesses appear across the economy during crisis: segments that even accelerate their pace in crisis. Second, such high diversity allows for resilient segments, even within industries which decline during crisis. Third, in recessions, besides the existence of resilient activities across the economy and even within declining industries, the whole structure of the economy also seems to change: there is a negative correlation between the segments and industries which grow and accelerate in periods of pre-crisis and crisis, respectively. Fourth, most resilient businesses belong to a few sectors and are a consequence of several factors beyond inelasticity and the Giffen effect: the availability of more free time, the need of comfort, the seek of pleasure and the need of savings. Thus, and finally, it is to be expected that resilient activities be similar independently of the specific crisis causes. These being at the root of the economy, impact mostly on what are the worst performing segments. Not the best.
That much is supported when comparing the 2020 Covid year data with that of the subprime crisis period (2008-2014): all correlation coefficients are positive.
As a first step, this article leaves considerable way for further research. That may include detailing the analysis by dividing the 615 segments into the 5224 niches existent in the economy (defined by the Eurostat with six digits). Or analysing differences among European Union countries (Sapir, 2020). Or still extending this article’s analysis of the EU economy to the USA and other parts of the world (Ehnts & Paetz, 2021) thus enabling geographical comparisons (Hsieh, 2011). In short, not only there is no shortage of venues for future research, but also the overall conclusion at present remains.
References:
Altunbas, Y., Manganelli, S., & Marques-Ibanez, D. (2011). Bank risk during the financial crisis: do business models matter?.
AMECO (2021, May 13). https://ec.europa.eu/info/business-economy-euro/indicators-statistics/economic-databases/
Cowling, M., Liu, W., & Ledger, A. (2012). Small business financing in the UK before and during the current financial crisis. International Small Business Journal, 30(7), 778-800.
De Beer, P. (2012). The impact of the crisis on earnings and income distribution in the EU.
Demyanyk, Y., & Van Hemert, O. (2011). Understanding the subprime mortgage crisis. The review of financial studies, 24(6), 1848-1880.
Donthu, N., & Gustafsson, A. (2020). Effects of COVID-19 on business and research.
Duchin, R., Ozbas, O., & Sensoy, B. A. (2010). Costly external finance, corporate investment, and the subprime mortgage credit crisis. Journal of financial economics, 97(3), 418-435.
Edey, M. (2009). The global financial crisis and its effects. Economic Papers: A journal of applied economics and policy, 28(3), 186-195.
Ehnts, D., & Paetz, M. (2021). COVID-19 and its economic consequences for the Euro Area. Eurasian Economic Review, 1-23.
Eurostat (2021, May). https://ec.europa.eu/eurostat/data/database
Fernandes, N. (2020). Economic effects of coronavirus outbreak (COVID-19) on the world economy. Available at SSRN 3557504.
Fidrmuc, J., & Korhonen, I. (2010). The impact of the global financial crisis on business cycles in Asian emerging economies. Journal of Asian Economics, 21(3), 293-303.
Gurtner, B. (2010). The financial and economic crisis and developing countries. International Development Policy| Revue internationale de politique de développement, (1), 189-213.
Hafiz, H., Oei, S. Y., Ring, D. M., & Shnitser, N. (2020). Regulating in pandemic: evaluating economic and financial policy responses to the coronavirus crisis. Boston College Law School Legal Studies Research Paper, (527).
Hsieh, W. (2011). The global economic recession and industrial structure: Evidence from four Asian dragons.
Khudyakova, T. A., & Shmidt, A. V. (2019). Impact of the global recession on financial and economic sustainability of industrial companies.
Kuckertz, A., Brändle, L., Gaudig, A., Hinderer, S., Reyes, C. A. M., Prochotta, A., … & Berger, E. S. (2020). Startups in times of crisis–A rapid response to the COVID-19 pandemic. Journal of Business Venturing Insights, 13, e00169.
Moore, T., & Mirzaei, A. (2016). The impact of the global financial crisis on industry growth. The Manchester School, 84(2), 159-180.
Lorenzo, M., & Lean, A. (2020). The Economic Impact of COVID-19. IDOSR Journal of banking, economics and social sciences, 5(11), 45-50.
Mishkin, F. S. (2011). Over the cliff: From the subprime to the global financial crisis. Journal of Economic Perspectives, 25(1), 49-70.
Ozili, P. K., & Arun, T. (2020). Spillover of COVID-19: impact on the Global Economy. Available at SSRN 3562570.
Pak, A., Adegboye, O. A., Adekunle, A. I., Rahman, K. M., McBryde, E. S., & Eisen, D. P. (2020). Economic consequences of the COVID-19 outbreak: the need for epidemic preparedness. Frontiers in public health, 8, 241.
Roy, S. (2020). Economic impact of Covid-19 pandemic. A Preprint, 1-29.
Ryan, S. G. (2008). Accounting in and for the subprime crisis. The accounting review, 83(6), 1605-1638.
Sapir, A. (2020). Why has COVID-19 hit different European Union economies so differently? (No. 18). Bruegel.
Sarker, P. (2020). Covid crisis: Fiscal, monetary and macro-financial policy responses. Sarker, Provash Kumer,(2020). Covid crisis: Fiscal, monetary and macro-financial policy responses, Theoretical and Applied Economics, 3(2020), 624.
Schwarcz, S. L. (2008). Disclosure’s Failure in the Subprime Mortgage Crisis. Utah L. Rev., 1109.
Setar, L., & MacFarland, M. (2012). Top 10 fastest-growing industries. Special Report IbisWorld. com. Available in: http://www. drugstorenews. com/sites/drugstorenews. com/files/Fastest% 20Growing% 20Industries-1. pdf.
Shiller, R. J. (2012). The subprime solution. Princeton University Press.
Sikder, M., Zhang, W., & Ahmod, U. (2020). The consequential impact of the Covid-19 pandemic on global emerging economy. American Journal of Economics, 10(6), 325-331.
Terazi, E., & Şenel, S. (2011). The effects of the global financial crisis on the central and eastern European Union countries. International Journal of Business and Social Science, 2(17).
[1] Information was obtained through an email exchange with Eurometaux during 2021