
Author: Jorge Sá
SUMMARY
The European Union has a specific (cohesion) fund aimed at increasing the competitiveness of the poorer countries. After fifty billion euros representing almost 4% of their national income, during a quarter of century the outcome is:
- 1st – The gap between the richer and poorer EU countries increased; and
- 2nd – The transparency, economic freedom and economic competitiveness of the poorer countries decreased…
This article provides very simple empirical, statistical, evidence for the above.
INTRODUCTION
The European Union has several types of funds: on agriculture, the fishing industry, human capital, etc. and also one called cohesion fund aimed at Member States whose Gross National Income (GNI) per inhabitant is less than 90 % of the EU average to reduce economic and social disparities and to promote sustainable development (quote)[1].
Its aim is thus to decrease the gap in income per capita between the richer and poorer EU countries.
But, is the cohesion fund working? What is the empirical evidence? What are the results of the fifty billion spent?
THE FINANCING
Figure one below shows the amount received from the cohesion fund (in order of importance) by Spain, Greece, Portugal and Ireland, during the last quarter of century.
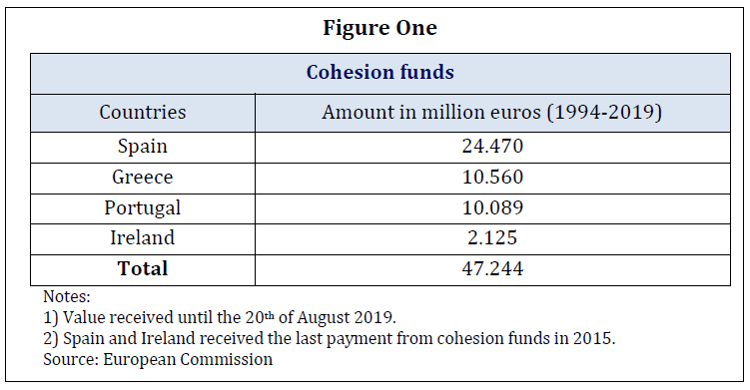
Although eastern countries belonging to the so-called enlargement group, such as Hungary, Slovakia, the Czech Republic, etc. are also recent beneficiaries of the cohesion fund, the four EU-15 countries in figure one have the advantage of allowing to analyse the results during a longer, quarter of century, period: from 1994 up to the present.
The total amount received during that period was nearly fifty billion euros, representing 3,7% of their national income. And what was the outcome, the results?
Let us separate the answer into three parts: 1) the countries ranking within EU-15 in terms of income per capita; 2) their gap, regarding the richer EU countries; and 3) the (eventual) causes.
THE RANKING IN TERMS OF INCOME
In 1995 the bottom four EU-15 countries were Portugal, Greece, Spain and Ireland. At present the bottom four are Portugal… Greece… Spain… and…: Italy (see figure two below)[2].
That is, Ireland changed places with Italy. The three others remain the same.
The GDP per capita of Greece is less than 2/3 of the EU-15 average, that is, if in average an European receives (e.g.) 100 euros, a Greek earns only 62,8 euros; a Portuguese 71,6 euros (71,6%); a Spanish 85,8 and an Italian 89. All below 90%.
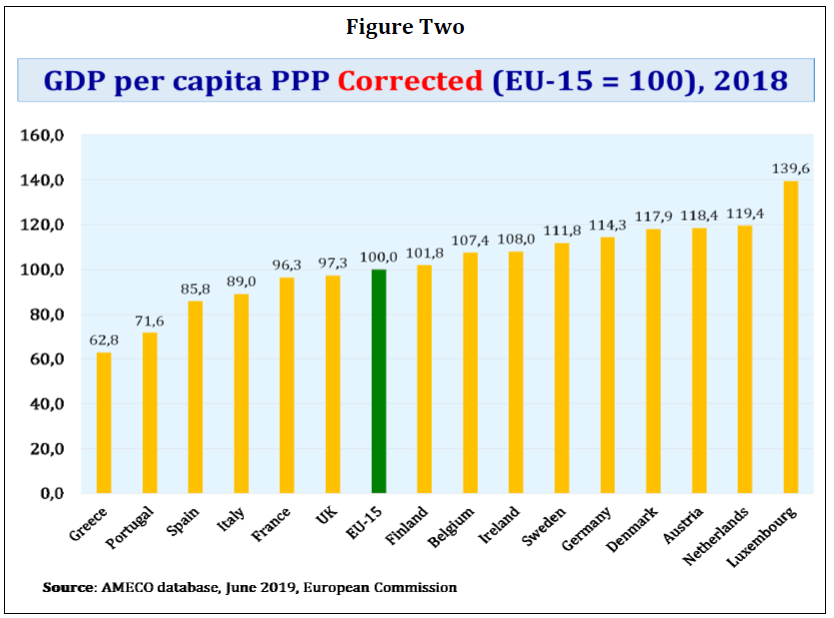
Ireland is now the seventh wealthiest EU-15 country being the richest Luxembourg, Netherlands and Austria (France and UK are below average and Finland, Belgium, Sweden, Germany and Denmark above).
Thus, after a quarter of a century, Greece, Portugal and Spain remain the poorest compared to the average. And more even so regarding the top of the table: a resident of Luxembourg earns 2,2 times a Greek (+120%), almost 2 times a Portuguese (+95%) and 1,6 times a Spanish (+60%).
But could it be that globally in terms of all fifteen countries the cohesion increased? That is, did the gap decreased?
THE GAP
The answer is no. And the simplest way to measure that is by using a statistic called the Gini index which varies from zero to one: zero means that all countries would have equal income; one that the difference would be maximum, with one country having all the income.
Thus, the greater the value of the Gini index (which varies between zero and one), the larger the gap, the diversity, the divergence, in income (among all EU-15 countries). Globally. Overall.
So? In 1995 the EU-15 Gini index was 0,156; and in 2018 it had increased to 0,195, a percentual increase of 25% (value of 2018 divided by that of 1995).
That means that during ± a quarter of century there was no trend towards cohesion or convergence, but rather towards difference and divergence.
And there are other ways to conclude that: in 1995 the top four countries of EU-15 had in average more 70% income than the poorer four ones[3].
But in 2018 that difference was 108%, that is the four richest have now more than double the income of the poorest four: a 38% increase in absolute terms (108-70) and 55%, more than half, in relative terms (108/70).
In short, the fifty billion euros that the European taxpayers put into the cohesion fund, failed to achieve their results as instead of convergence, occurred divergence, an increased gap.
But, why?
THE (EVENTUAL) CAUSES
Although a thorough analysis is beyond this article’s scope, it is interesting to look at three indicators: 1) transparency; 2) economic freedom; and 3) economic competitiveness.
Transparency International (headquartered in Berlin) and the Heritage Foundation (in Washington) are two NGOs which rank most world countries in terms of transparency (the opposite of corruption) and economic freedom, that is the degree to which there is a great deal of competition within a country’s markets, with few monopolies and oligopolies.
Figure three below indicates how the world ranking of the sample of the four countries evolved during the last twenty five years
Spain in 1995 was 26th in transparency and 34th in economic freedom; a quarter of century later it ranked 30th and 57th in the world (4 and 23 positions worse, respectively).
In the same period Greece went from 30th to 60th in transparency (dropped 30 places) and from 42nd to 106th in economic freedom (a difference of 64 in ranking for worse).
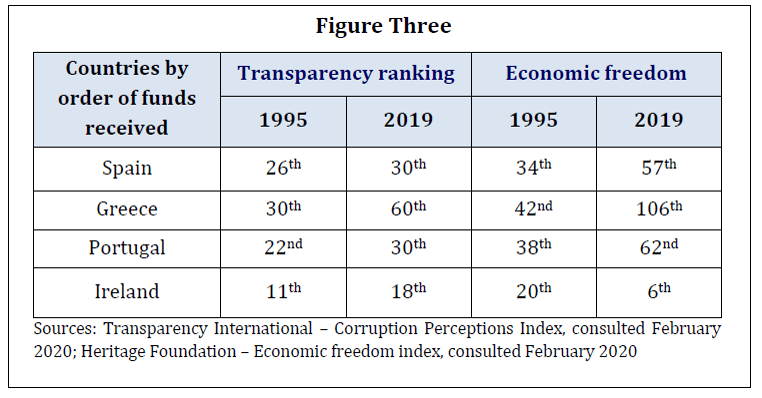
Portugal’s transparency worsened from 22nd to 30th and economic freedom from 38th to 62nd.
And Ireland also dropped seven places in transparency (from 11th to 18th), being the single exception of its economic freedom ranking, which improved from 20th to 6th (see the two columns in the right at the last line of figure three.
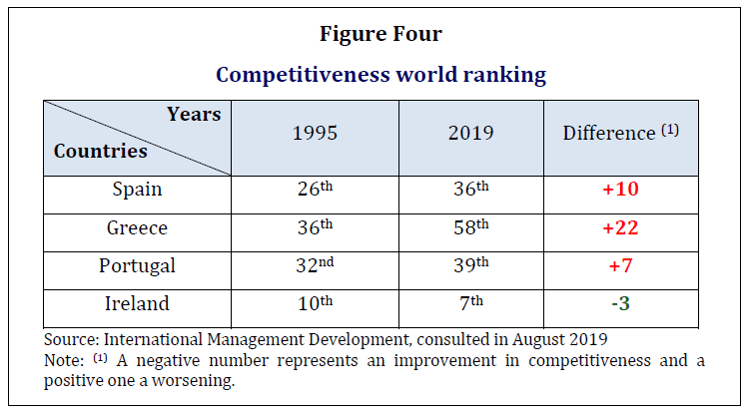
In terms of economic competitiveness (an index produced by the Institute for Management Development in Lausanne), Ireland is again the single exception as per table four next: in a quarter of century it improved from 10th to 7th place in the world. But Spain dropped from 26th to 36th in ranking, Greece from 36th to 58th and Portugal from 32nd to 39th.
Sure, that the number of countries analyzed in all three indexes (transparency, economic freedom and competitiveness) increased, but the new add-ons were almost all third world, if not fourth, world countries.
After all there was only 28 (now 27) countries in the European Union. And OECD has solely 36 members (plus six other countries are candidates for accession and key partners, with Russia being an associate).
CONCLUSION
After fifty billion euros spent during a quarter of century what does the cohesion fund has to show for results?
First: three of the bottom four countries remain the same: Greece, Portugal and Spain.
Second: the overall gap between the income of all fifteen EU-15 countries increased: there was divergence, not convergence. And the difference between the poorer and richer four countries, too.
Third: three of the poorer countries (Greece, Portugal and Spain) worsened in their world rankings in terms of transparency, economic freedom and competitiveness.
The single exception was Ireland: in terms of economic competitiveness and economic freedom, but not transparency.
Having said that, that does not mean two things:
First, that the recipients of the cohesion fund are poorer in absolute terms. Definitely not. Their national income per capita improved.
But so has that of most of the countries around the world. Many of which did not receive almost 4% of their national income, from Brussels during a quarter of century.
And nevertheless, the countries benefiting from the cohesion fund, became poorer relative to, by comparison to the wealthier EU countries.
Second, no conclusion is here suggested that the situation would be better without the cohesion fund. That inference would require a parallel world (without the cohesion fund) to compare with.
But there are definitely two words which summarize the results. The first is surprise: the poorer countries ranking in transparency, economic freedom and competitiveness, worsened, overall. And the second word is disappointment.
Since and as has been said, facts are our friends and denial does not change reality, but can make it deadly, thus the question: is that the best we can do? Or do we have to change course?
After all, one of the definitions of madness, is to keep on doing the same things and expect… different results.
[1] Source: European Commission: https://ec.europa.eu/regional_policy/en/funding/cohesion-fund
[2] The values are taken from the European Commission database of Ameco and are corrected to take into account two factors: in the case of Luxembourg ± 40% of its workforce are nonresidents and in the case of Ireland, following the practice of its national statistical office, one must deduct from the income multinationals which have no real activity in Ireland, but have residence there only for tax purposes.
[3] Luxembourg, Germany, Austria and Netherlands; versus Ireland, Spain, Greece and Portugal.