
This article by Professor Jorge Sá was recently published on the blind-referee Journal of Social and Economic Studies (USA).
Professor Jorge Sá, a Peter Drucker expert and a speaker on Peter Drucker, is a senior research fellow at Peter F. Drucker and Masatoshi-Ito Graduate School of Management in Los Angeles, a visiting Professor at IESE associated AESE and a Professor at ISG Business School.
(site: www.vasconcellosesa.com ; e-mail: associates@vasconcellosesa.com)
Read the full article below:
Within Economic Blocks, Countries and States Tend to Diverge (Not Converge)
Authors: Jorge Sá and Ana Lúcia Luís
Abstract: When countries form an economic block, they team up in order to benefit each other’s economies. The deals can range from just lower tariffs to something much more complex, as with the European Union (EU). There is considerable literature which indicates the trend toward convergence among members as one of the advantages of economic blocks. It is expected that benefits will be surplus to disadvantages and that integration in a block will lead to convergence. The expectation is that within economic unions, there is not only a general increase in welfare, but also economic convergence, greater income similarity among its members: since it is far easier to copy than to innovate, regardless of the type of innovations, the dissemination of innovations would create similar standards among all within an economic block. This article presents empirical evidence for the opposite, that within economic blocks, be they of countries or federal states, they tend to diverge, not converge. Analysis of EU countries and federal states of the U.S. shows a trend towards divergence.
Introduction
In spite of recent reversals (e.g. the transpacific trade agreement) and some trade wars (between the USA and China), the world is today, in general, a freer economic space than a few decades ago.
The trend is towards the liberalization of global trade, under the auspices of the World Trade Organization and due to several economic unions such as the ASEAN (Association of Southeast Asian Nations), the Mercosur, NAFTA and the European Union (Sharma et al, 2020).
The advantages of free trade bringing lower prices of goods and services are due to the disappearance of 1) trade barriers, 2) higher specialization where countries have competitive advantages, the benefits of a larger market enabling the creation of 3) economies of scale and 4) experience effects embodied in learning curve (Drozdz and Miškinis, 2011; Froning, 2000).
To the above benefits, economic blocks add others: 5) free movement of labour and capital, 6) central policies common to all member countries and 7) financing from wealthier to poorer countries (or states) (Coskun, 2016).
Still, the expectation is that within economic unions, there is not only a general increase in welfare, but also economic convergence, greater income similarity among its members: since it is far easier to copy than to innovate, regardless of the type of innovations, the dissemination of innovations would create similar standards among all within an economic block; in top of the effect of the central funding for poorer member states (Garcia et al, 2020; Monge-Naranjo, 2019; Moreno and Torres, 2000).However, although the above arguments are theoretically appealing, empirical evidence suggests the opposite: within economic unions the trend is towards an increase in the difference among standards of living: as the richer become richer, and the poorer, poorer, in relative terms.
The example of the European Union
The EU started with only six countries and has expanded from western Europe to central and eastern Europe. What began as a union focused on economic stability has since evolved to other areas. Along the way, the initial homogeneity between countries, that could be a facilitator of convergence, was broken. And convergence between member states was somehow compromised.
Convergence is a broad concept. Real convergence is a term that refers both to income convergence, the catching-up in per capita GDP, and to institutional convergence, the convergence of institutions and social economic structures (Glawe and Wagner, 2021).
Only income convergence will be analysed, between EU countries and between several USA states.
Figure 1 compares the GDP per capita for the last quarter of century both for EU-15 and for the USA. The analysis is done for the former EU-15 and not the Eurozone or EU-28 as the former is older and thus allows for a longer term analysis. The years 2019 and 2020 were excluded from the analysis to avoid the impact of the Covid crisis.
Figure 1 – Comparison of the GDP per capita of top and bottom four EU-15 countries and USA states
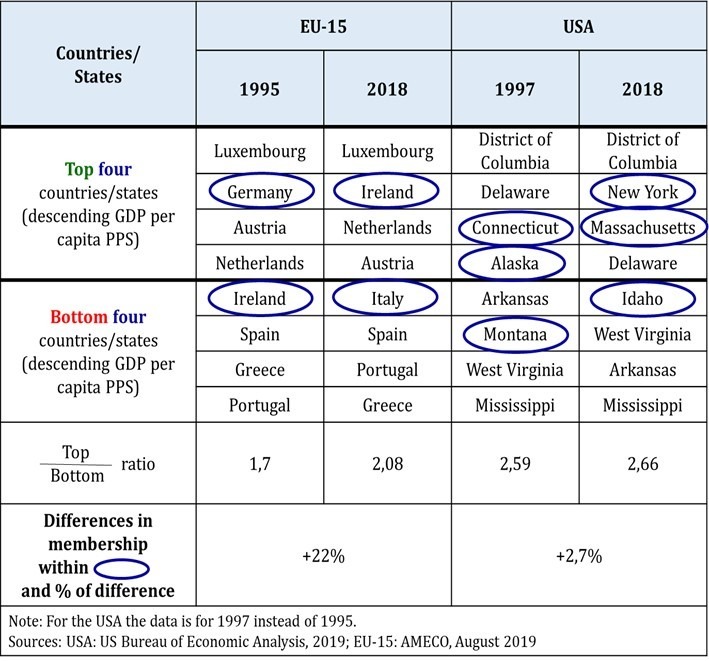
In 1995 the richest four European countries (Netherlands, Austria, Germany and Luxembourg), had in average more 70% of income than the poorer four: Portugal, Greece, Spain and Ireland (ratio of 1,7).
In 2018, however, the top four had more than double the income of the poorer countries (+108%)[1]: ratio of 2,08. Thus the difference in income between richer and poorer countries increased relatively by almost a quarter (22%: 2,08/1,7).
And the same holds if we compare the seven (top) and seven (bottom), as illustrated in the left side of figure 2.
Figure 2 – Comparison of the income of top and bottom seven EU-15 countries and USA states
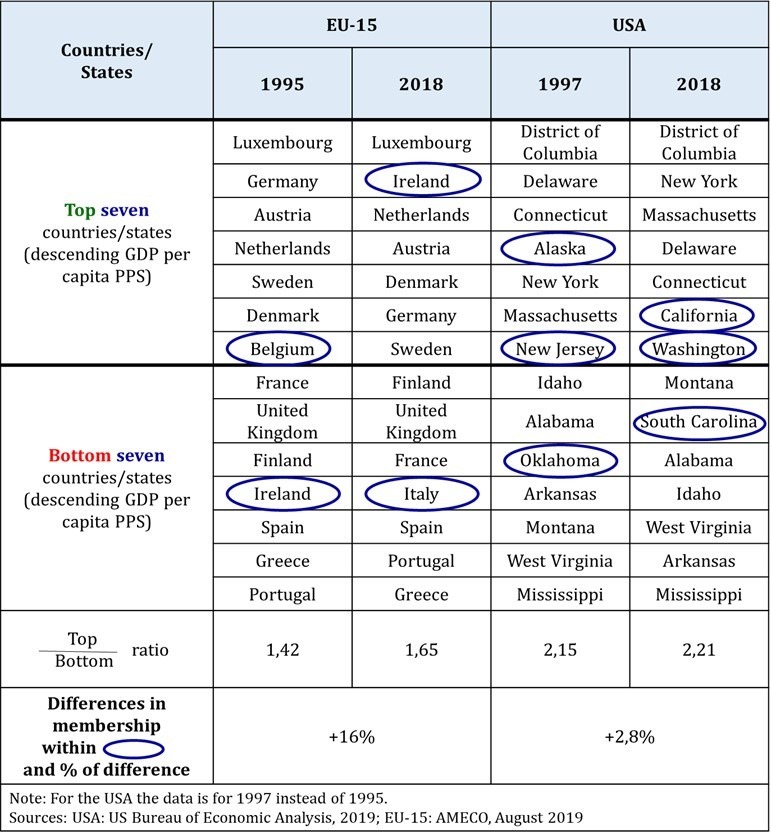
In 1995 the EU-15 difference in average wealth was 42% (ratio of 1,42) but in 2018 had augmented to 65% (ratio of 1,65)[2]. So, divergence occurred again.
The major changes in a quarter of century were: Ireland changed from the bottom to the top group, while Belgium, now the 8th wealthier country, left the top seven group. Everything else remained the same. And at the bottom Portugal and Greece changed places as the poorest country and Ireland was replaced by Italy.
At present the five poorer countries are Greece, Portugal, Spain, Italy and France, then the UK and finally Finland.
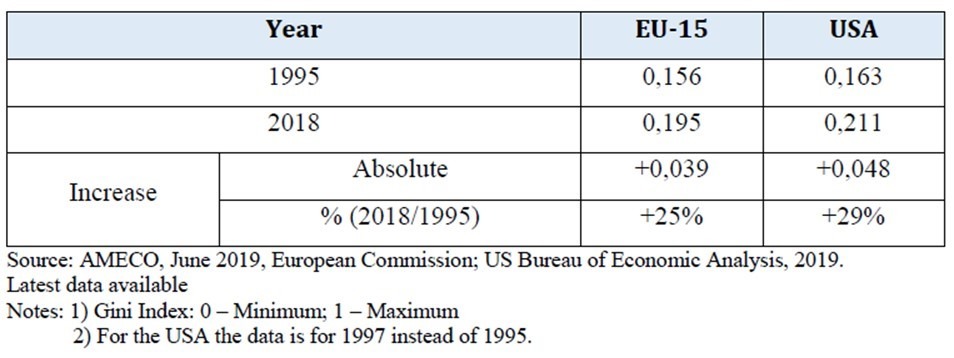
And if one wishes to compare all (fifteen) countries within the former EU-15 the Gini index can be used. As is known, it is a statistic which varies from zero (all countries having equal income) to one (meaning that theoretically one country would have all the income and all others zero income). So the higher the index, the greater the diversity in countries income.
And again the data indicates that in 1995 the value of the EU-15 Gini index was 0,156 but in 2018 it had become 0,195 (an increase of 25%: 0,195 / 0,156).
In short, in roughly a quarter of a century income divergence among European countries increased considerably.
But, is that something peculiar, unique, to the European Union?
The example of the United States of America
The answer is no. Between 1995 and 2018 the Gini index of the federal states of USA (a two centuries old economic union) also increased from 0,163 to 0,211, almost a 30% increase, as per figure 3.
Figure 3 – Comparing the Gini index (for all EU-15 countries and states of the USA)
And, as indicated in the right side of figures 1 and 2 before, if we compare the top and bottom four, the difference in income also augmented from +159% to +166%. And for the top seven against the bottom seven, the values are 115% and 121%, for 1997 and 2018 respectively, a percentage increase of +6%.
Finally, when comparing the top ten and bottom ten the difference increased from +92% to +99%[3].
In sum, both within the European Union and the USA, and regardless if one compares groups of four, groups of seven, groups of ten, or all countries (federal states) together, the outcome is the same: with time, inequality in income increased. The gap between the richer and the poorer augmented. The trend was towards divergence, not convergence.
Comparing the EU with de USA
The above conclusion comes further reinforced if we compare the European Union against the USA. Indeed in figure 3, the Gini indexes of the USA (both in 1995 and 2018) are greater than those of Europe (0,163 against 0,156 and 0,211 against 0,195, respectively).
Since the USA is a two centuries old economic union and Europe only decades so, that again suggests that with time the trend is towards divergence, not convergence. And in spite that the central USA budget is far greater than that of the European Union.
But, why is there such a trend, in spite of the arguments for convergence referred at the beginning of this article? After all, it is easier to copy than to innovate and central governments funding to improve the competitiveness of the poorer regions.
One hypothesis are the advantages that richer regions can offer. First to labour: better wages attract the best; there is a brain drain of the poorer regions.
And then being richer, the more dynamic regions also offer greater opportunities to remunerate well the capital.
Entrepreneurship means shifting resources from lower value to higher value opportunities. A far easier task within economic blocks, in the absence of internal barriers either to labour or capital movements.
Conclusion
Within economic blocks there is a trend towards divergence. And empirical evidence for that comes from three sources.
First, when one analyses the EU-15 over time: be it the top four countries against bottom four; or the top seven against bottom seven; or still the Gini index for all fifteen countries.
Second, when one analyses the evolution of the federal states of the USA: again in terms of groups of four, seven, ten and all states (Gini index).
And thirdly when rather than a longitudinal, one makes a geographic comparison between the “older” USA and the more recent European Union.
As a final note, two words of caution are due, here. First, divergence should not be confused with impoverishment (Boudreaux and Ghei, 2017), since the fact that the poorer regions (countries or states) become poorer relatively, does not mean that they also become so in absolute terms. Only that the poorer improve less than the richer.
And second, there is still the different question if the poorer regions would have been better off if they did not belong to an economic union.
That is a difficult question to answer in the absence of parallel worlds, with e.g. Greece between 1995 and 2018 simultaneously belonging to and not belonging to the European Union.
And if we were to compare the 25 years before (e.g.) Greece joined the European Union with the 25 years thereafter, we could be comparing “oranges and apples” as the contexts are not similar. The world from 1970 to 1995 was quite a distinct place from that from 1995 to 2018. For instance, in the early seventies Greece (and also Portugal and Spain) were under a dictatorship.
In any case, given the advantages of trade liberalization in general and economic unions in particular, the answer is probably that is pays off to be a member of the EU, ASEAN, NAFTA, etc.
In spite of the ever greater economic disparities of the increasing divergence.
References:
Boudreaux D. J., Ghei N. (2017). The Benefits of Free Trade: Addressing Key Myths, Mercatus Center, George Mason University, Policy brief; January.
Coşkun M. (2016). The Global Trend Towards Trade Liberalisation: A Theoretical Analysis Of Reasons For Developed And Developing Countries, Mehmet Akif Ersoy University Journal of Social Sciences Institute, 1 (13): 283-295.
Drozdz J., Miškinis A. (2011). Benefits and threats of free trade, Ekonomia/Economics, Nr 2 (14): 40-48.
European Commission (2019). AMECO database: http://ec.europa.eu/economy_finance/db_indicators/ameco/index_en.htm
Froning D. (2000). The Benefits of Free Trade: A Guide for Policymakers,The Heritage Foundation Backgrounder, No. 1391; August 25.
Gancia G., Ponzetto G. A. M., Ventura J. (2020). A theory of economic unions, Journal of Monetary Economics, Volume 109: 107-127.
Glawe, Linda; Wagner, Helmut (2021). Divergence Tendencies in the European Integration Process: A Danger for the Sustainability of the E(M)U? Journal of Risk and Financial Management 14: 104.
Hufbauer G. C., Kotschwar B. (1998). The Future Course of Trade Liberalization, Peterson Institute for International Economics.
Monge-Naranjo A. (2019). A Theory of Economic Unions – A Comment, Federal Reserve Bank of Saint Louis, Working paper 2019-035.
Moreno B., Torres J. L. (2000). The Sustainability of Economic Unions in the Third-Market Model, Centre for Research on Globalisation and Labour Markets, Research Paper 2000/4.
Sharma S. C., Gupta P., Gupta R. (2020). A Comparative Analysis of the Benefits of Free Trade Agreements on FDI, between Developed Countries & Developing Countries, International Journal of Management, Volume 11, Issue 12: 1841-1852.
US Bureau of Economic Analysis (2019): https://www.bea.gov/data/gdp/gross-domestic-product.
[1] Between 1995 and 2018 in the group of the richer countries, there was a single change: Germany was replaced by Ireland. And within the group of the poorer countries there was also only one modification: Ireland was replaced by Italy.
[2] In 1995 the top seven were (by decreasing order of income per capita) Luxembourg, Germany, Austria, Netherlands, Sweden, Denmark and Belgium; and the bottom seven were France, United Kingdom, Finland, Ireland, Spain, Greece and the poorest of all, Portugal. In 2018 the top seven were Luxembourg, Ireland, Netherlands, Austria, Denmark, Germany and Sweden; and at the bottom there were Finland, UK, France, Italy, Spain, Portugal and Greece.
[3] In the case of EU-15 one could obviously compare only seven to seven.